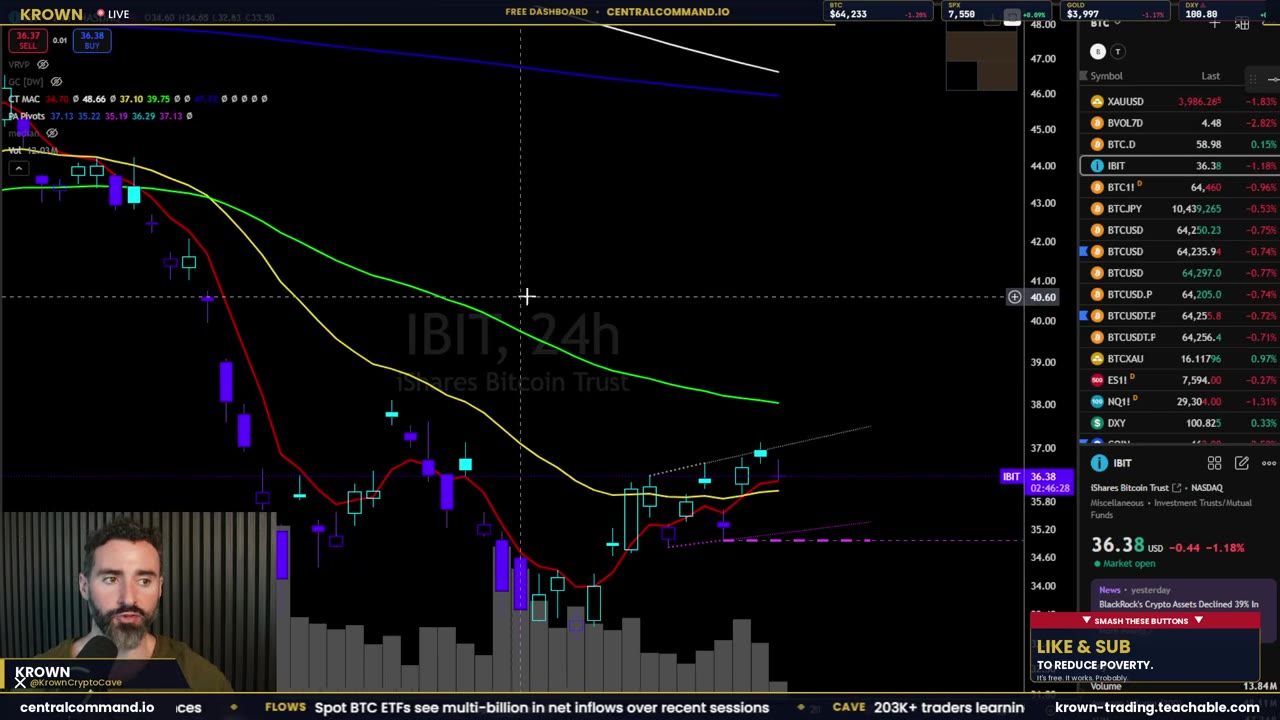
Bitcoin’s iBit chart has just flashed a bullish signal, catching the eye of analyst Krown. A key crossover on the ETF’s chart hints at a potential move towards $67,200, and traders are taking notice.
Key Bullish Signal on Bitcoin’s iBit Chart
There is a notable technical signal on the iBit chart for Bitcoin, says Krown of the Krown channel. The red EMA-5 has crossed above the yellow EMA-21, and as Krown points out, this is a crossover many traders see as an indication of fresh bullish momentum and a precursor to an upward move. The immediate objective is the green EMA-55; at present, that is in the vicinity of $38 per iBit ETF share, or about $67,200 for a bitcoin.
The numbers bear this out. A look at the last 15 occurrences of such a crossover on the iBit chart shows 14 were followed by a sharp reversal from the prior trend. It is a pattern with enough of a track record to have traders taking note.
Other Bullish Indicators and Potential Risks
There are bullish signals on other charts as well, according to Krown. A look at the CME Bitcoin futures chart reveals a setup for a stochastic oscillator crossover and what could turn out to be a bullish RSI divergence; taken together, these indicators suggest bitcoin may be in a position to recover from its recent losses.
The MACD is also showing early signs of a potential bullish reversal. Should it cross the zero line in the near term, that would further strengthen the argument for a bullish move.
At the same time, Krown is quick to point out some invalidation levels for his audience. The bullish case is put in jeopardy if a daily candle closes under $62,200 or if the price tests support at $61,870. It is prudent for traders to monitor those levels to guard against any downside.
Why This Matters for Crypto Traders
A trader who can read the technical signals on a Bitcoin iBit chart is better positioned to manage risk and anticipate market movements. Take the present alignment of indicators, for example: with the EMA crossovers, RSI divergence, and MACD all in agreement, the odds of a significant price move are heightened.
Such circumstances are as much a cause for caution as they are an opportunity for those new to the game. A bullish reading may be encouraging, but one should keep a watchful eye on key levels and any hint of a reversal. In real time, it is useful to follow the lead of seasoned analysts such as Krown to make sense of what can be complex data.
Source — Krown: https://www.youtube.com/watch?v=d3bZ-SAcPE4