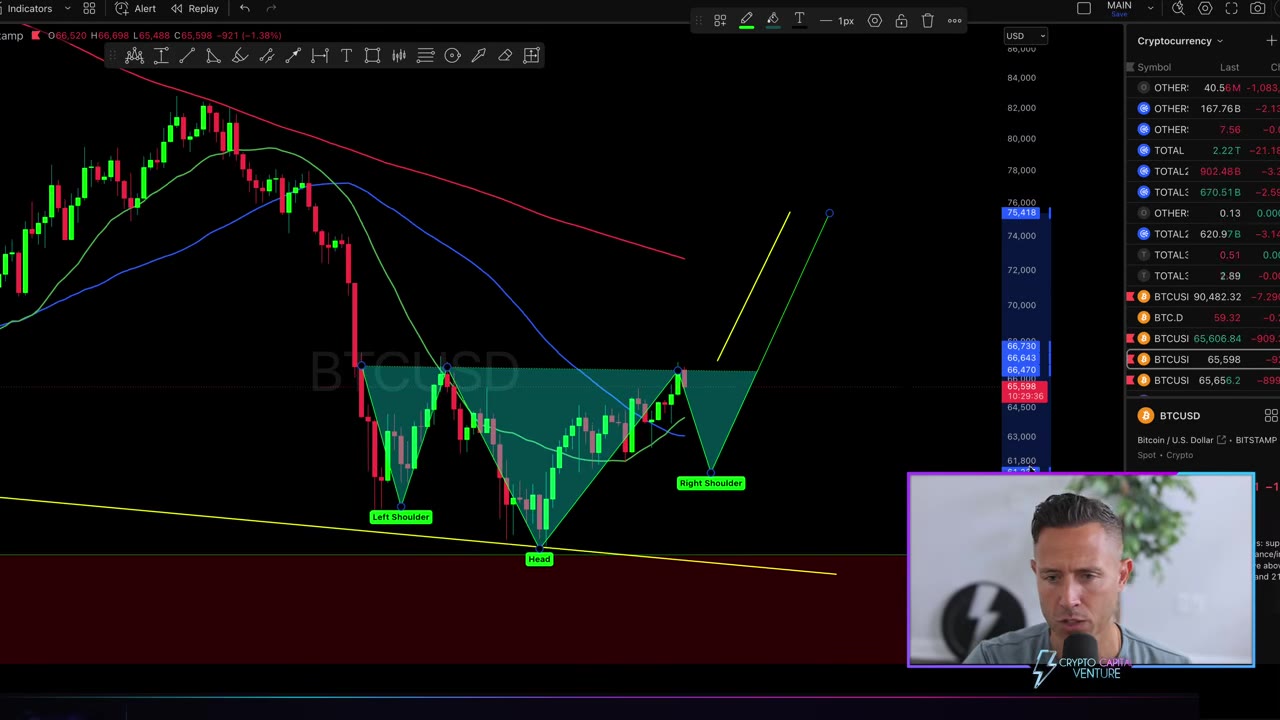
A Bitcoin inverse head and shoulders pattern is taking shape on the daily chart, a development an analyst with Crypto Capital Venture has put to good use in forecasting a possible run to $75,000.
Daily Chart Structure Points to Bullish Reversal
Looking at the current structure on the daily timeframe, the Crypto Capital Venture analyst sees a textbook case of this technical formation. It is considered a dependable sign of a bullish reversal after an extended correction. The view from the desk is that if Bitcoin can put in the work to clear its resistance and get above the 200-day moving average, it will be enough to spark a sizeable move higher. Pattern projections put the target for such a breakout in the vicinity of $75,000.
There is no underestimating what a breach of the 200-day moving average would mean for Bitcoin; it represents a macro shift of some consequence. That figure has long been a point of contention for bulls and bears alike, so a firm move past it is likely to draw in fresh interest from both institutional and retail sides. Even with the bullish outlook, one should not rule out the possibility of a near-term pullback to find support in the $63,000 to $64,000 range.
Short-Term Risks and Support Levels
The Bitcoin inverse head and shoulders pattern is cause for optimism, but the analyst with Crypto Capital Venture would have one temper that view with the possibility of a short-lived correction. In the near term, we could see Bitcoin retrace to its support zone of $63,000 to $64,000 before a bullish trend is truly established. Such a test of support is not without merit; it can weed out weaker hands and in doing so validate the pattern, paving the way for a more robust rally down the line.
There is an eye on these levels by investors for good reason. Should they fail to hold, the bullish case is off the table and further downside follows. But if the support stands firm, it goes some way to underpin the credibility of the inverse head and shoulders formation.
Ethereum Mirrors Bitcoin’s Technical Setup
Ethereum’s chart tells a similar story, with the analyst noting an inverse head and shoulders formation. What matters for Ethereum at this juncture is its behavior in relation to important support and resistance as the pattern nears its end.
Then there is the matter of the trendline that has linked the lows of June 2022 to the 2025 highs; holding above it would be a significant technical development. Such a move might well put the stamp on a bullish reversal for Ethereum and set off a more widespread rally among altcoins.
Source — Crypto Capital Venture: https://www.youtube.com/watch?v=iuZTZHipaG0
